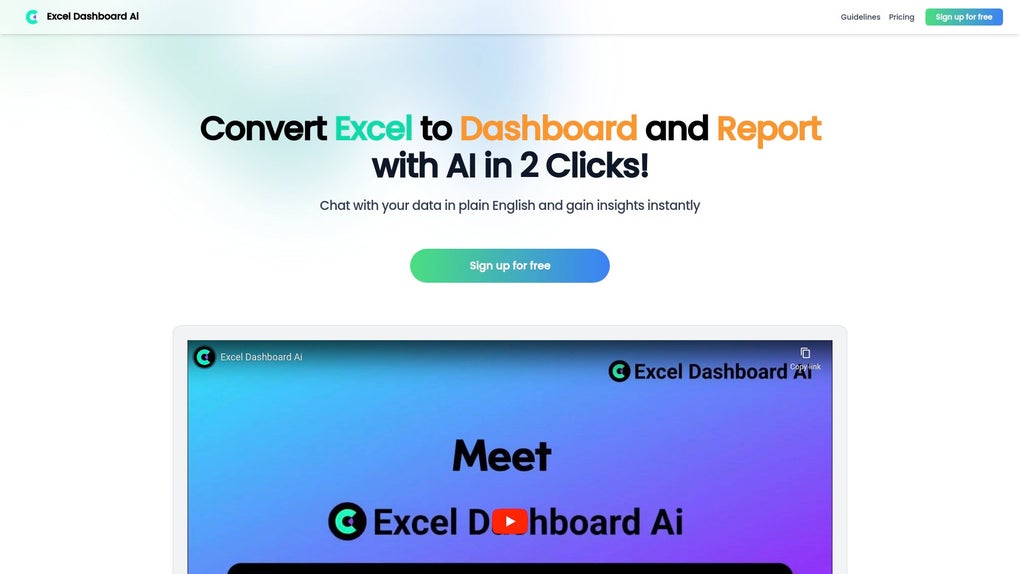
ExcelDashboard AI
ExcelDashboard offers powerful AI-driven tools for creating insightful data visualizations and efficient data analysis dashboards.
English
What is ExcelDashboard AI?
ExcelDashboard AI is a web-based application designed to transform Excel files into interactive dashboards and analysis reports. It acts as a powerful data assistant, processing large amounts of data from Excel sheets and converting raw information into visually appealing dashboards. This tool enhances data visualization, making it easier for users to identify trends and patterns, thereby facilitating data-driven decision-making across various sectors. The automated reporting feature further streamlines workflows, enabling users to generate detailed reports instantly without the need for manual analysis or coding skills.
Core Functions
Data conversion from Excel files.
Creation of interactive dashboards.
Automated report generation.
Enhanced data visualization.
Use Cases and Applications
Convert financial statements and performance metrics from Excel into interactive dashboards for better insights and decision-making in finance departments, helping stakeholders understand complex financial data more easily.
Transform sales data from Excel into visual representations to identify trends, track performance, and optimize strategies, aiding sales teams in making informed decisions and improving overall sales outcomes.
Process HR data from Excel into comprehensive reports and dashboards, providing HR professionals with clear overviews of employee statistics, benefits, and compliance issues, thus supporting effective management and policy development.