What is Easy Charts?
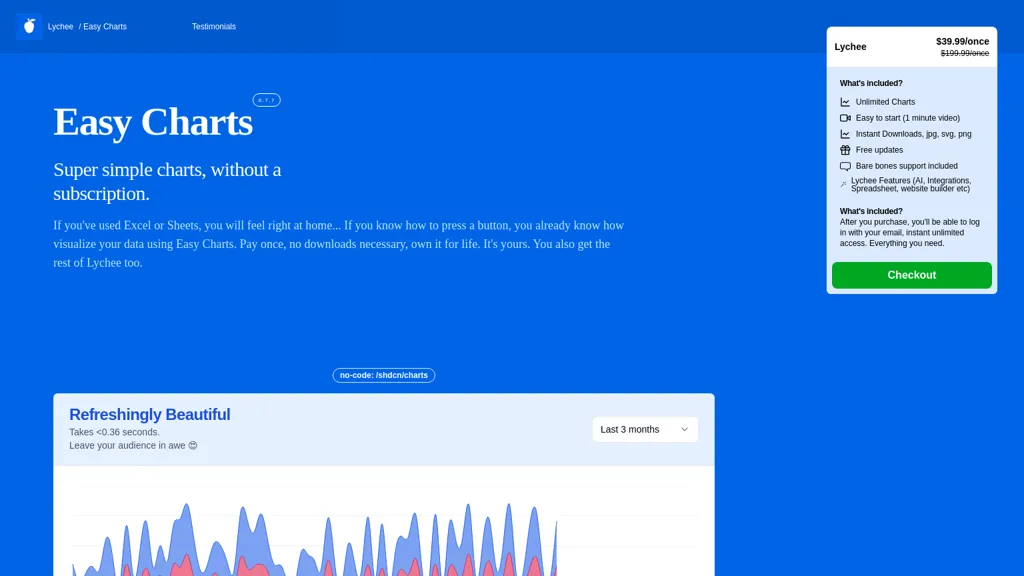
Easy Charts is a user-friendly tool for creating and customizing data visualizations. You don't need any subscriptions or downloads to use it. It allows you to generate unlimited charts and export them in various formats like JPG, PNG, and SVG. Ideal for those familiar with Excel or Sheets, Easy Charts makes it easy to produce professional-looking charts quickly. No downloads are needed; you can generate and export charts effortlessly with just a few clicks.
Key Features
User-Friendly Interface: Simple and intuitive design for quick chart creation.
No Subscriptions Required: Accessible and free to use.
Unlimited Chart Generation: Create as many charts as you need without limits.
Multiple Export Formats: Easily export charts in JPG, PNG, and SVG formats.
Compatibility: Works well for users comfortable with Excel or Sheets.
Use Cases & Applications
Business Presentations: Generate professional charts for reports and presentations.
Educational Materials: Create clear and engaging visual aids for teaching.
Data Analysis: Visualize data effectively for better insights and decision-making.
Marketing Reports: Produce visually appealing charts for marketing analytics.
