Current location: Home> AI Tools> AI Research Tool
Excel Dashboard AI

Excel Dashboard AI

Unlock powerful data visualization with our Excel Dashboard AI, effortlessly creating insightful reports and interactive dashboards using cutting-edge artificial intelligence.
Author:LoRA
Inclusion Time:23 Dec 2024
Visits:3778
Pricing Model:Free
Introduction

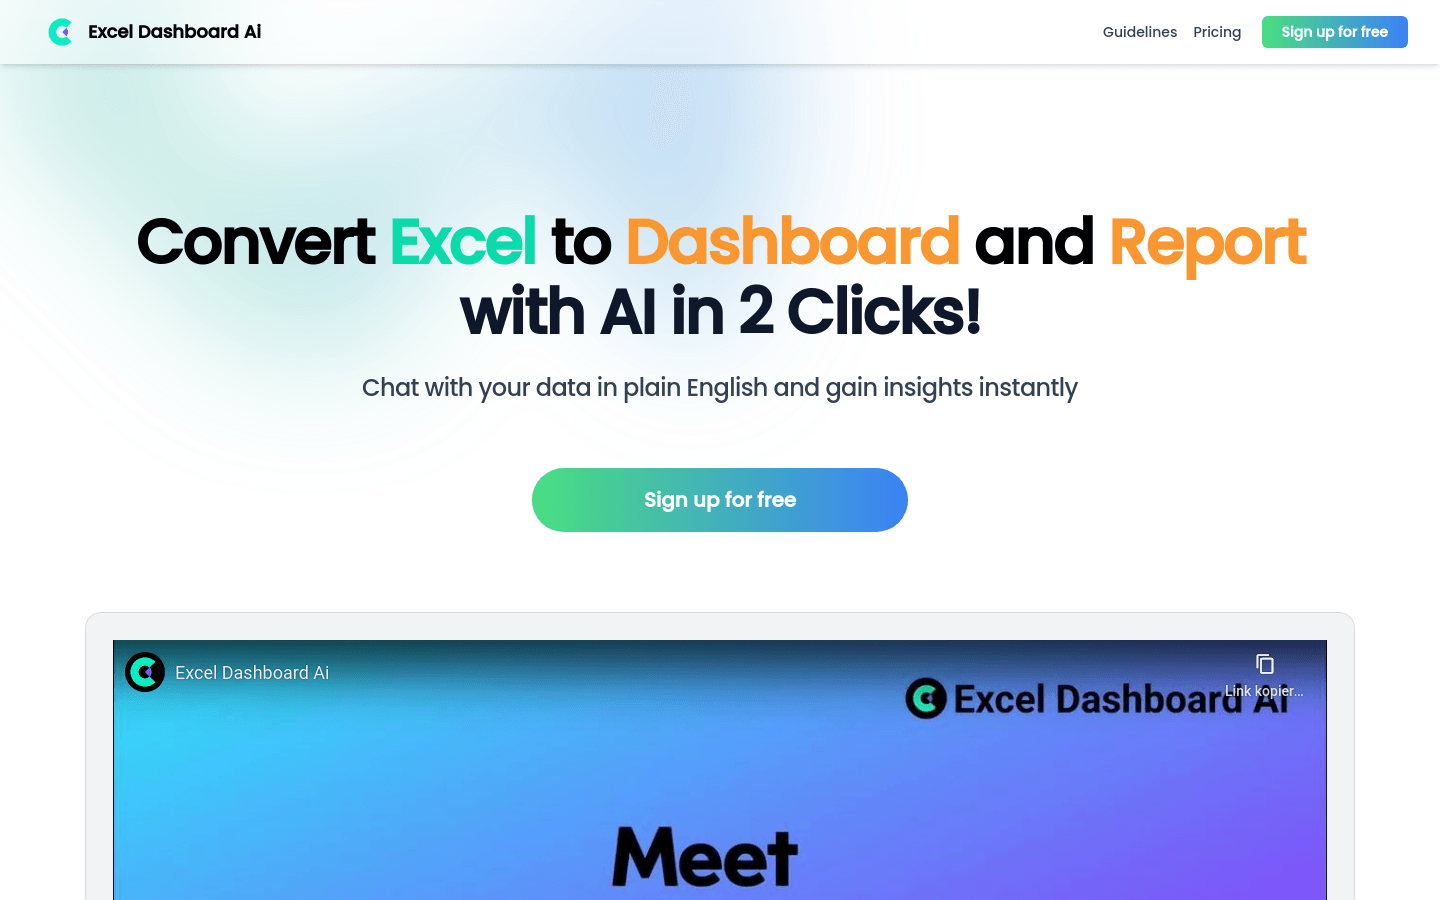
Excel Dashboard AI is a tool that uses artificial intelligence technology to quickly convert Excel data into interactive dashboards and analysis reports. It uses natural language processing capabilities to allow users to communicate with data in a conversational format to quickly gain insights. The main advantages of the product include rapid generation of diverse data analysis dimensions, natural language editing and locking of analysis perspectives, one-click generation of interactive dashboards, AI interpretation of chart meanings, and conversion of dashboards into detailed analysis reports.

Demand group:

"The target audience of Excel Dashboard AI is mainly business people, data analysts and corporate decision-makers who need to quickly obtain insights and reports from large amounts of data. It is suitable for those who seek to improve data processing efficiency, simplify the report production process and want to display it in an intuitive way Data users."

Example of usage scenario:

Business analysts use Excel Dashboard AI to quickly generate dashboards of sales data to present key metrics in meetings.

Data scientists use this tool to explore different dimensions of data to discover underlying market trends.

Business decision-makers get real-time data updates through dashboards to make smarter business decisions.

Product features:

Convert Excel to dashboards and reports in 2 clicks with AI technology.

Use natural language to talk to your data and gain instant insights.

Batch analysis to easily explore different data dimensions.

Create custom data dashboards with one click.

Instantly generate data analysis reports.

Get instant answers from AI by asking questions.

AI explores diverse data dimensions and provides 10 different data analysis dimensions to choose from.

Easily generate new charts and add them to your dashboard using natural language commands.

Download the dashboard as a comprehensive data analysis report with editable charts.

Usage tutorial:

Register and log in to the Excel Dashboard AI website.

Upload or link your Excel data files.

Use natural language to talk to the data and ask the questions or dimensions you want to analyze.

Based on the results provided by AI, select and edit the analysis dimensions you are interested in.

Generate interactive dashboards with one click, adjust and customize them as needed.

Download the dashboard as a detailed data analysis report for further sharing or display.

Alternative of Excel Dashboard AI
  • Second Me

    Second Me

    Second Me , an open source AI identity system designed to provide each user with a deeply personalized AI proxy.
    Open source artificial intelligence privacy protection AI
  • Skarbe

    Skarbe

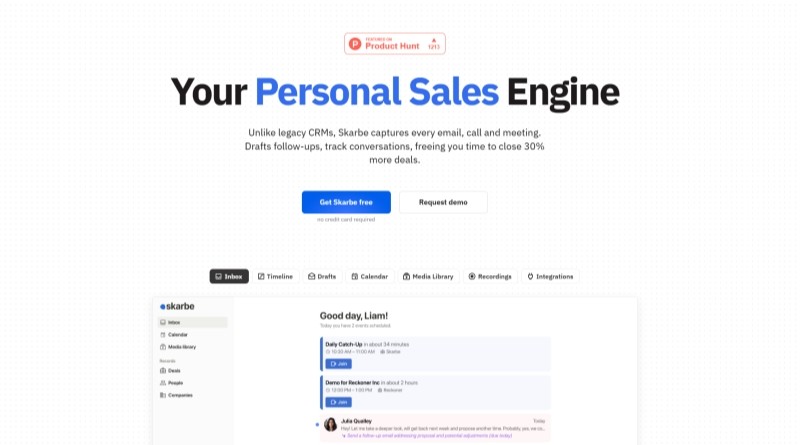
    Skarbe is an AI sales tool specially designed for small and medium-sized enterprises. It automatically tracks transactions, drafts follow-up emails, and organizes customer interactions to help salespeople save time and increase transaction closure rates.
    Sales automation tools AI sales assistants
  • Motia

    Motia

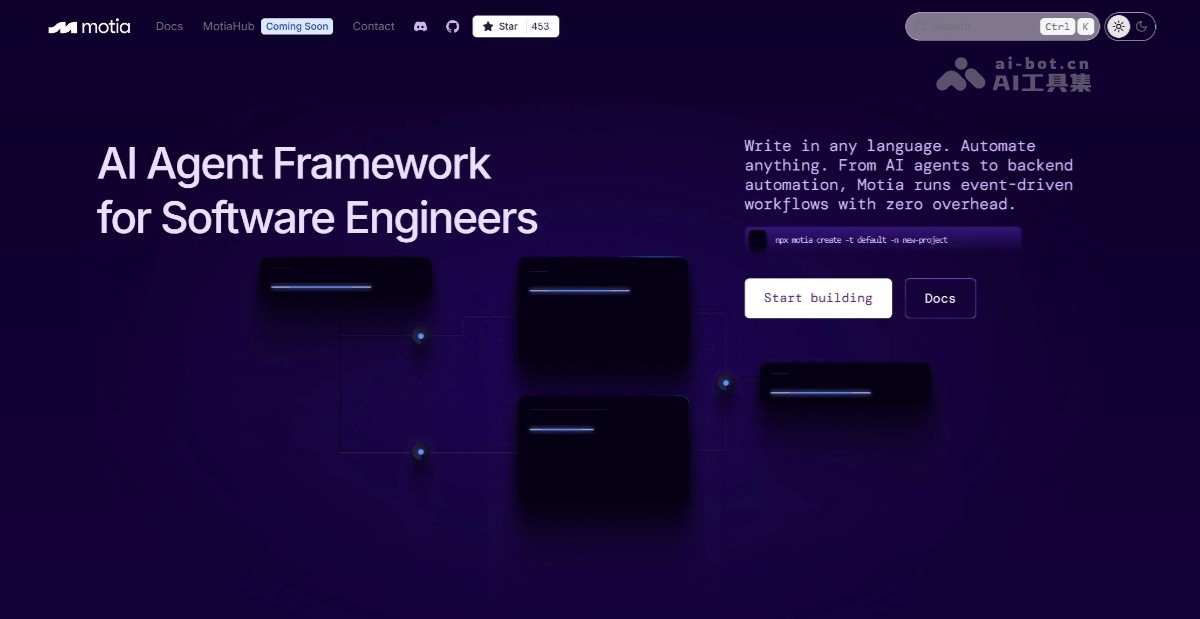
    Motia is an AI Agent framework designed for software engineers that simplifies the development, testing and deployment of agents.
    Intelligent development zero infrastructure deployment
  • WebDev Arena

    WebDev Arena

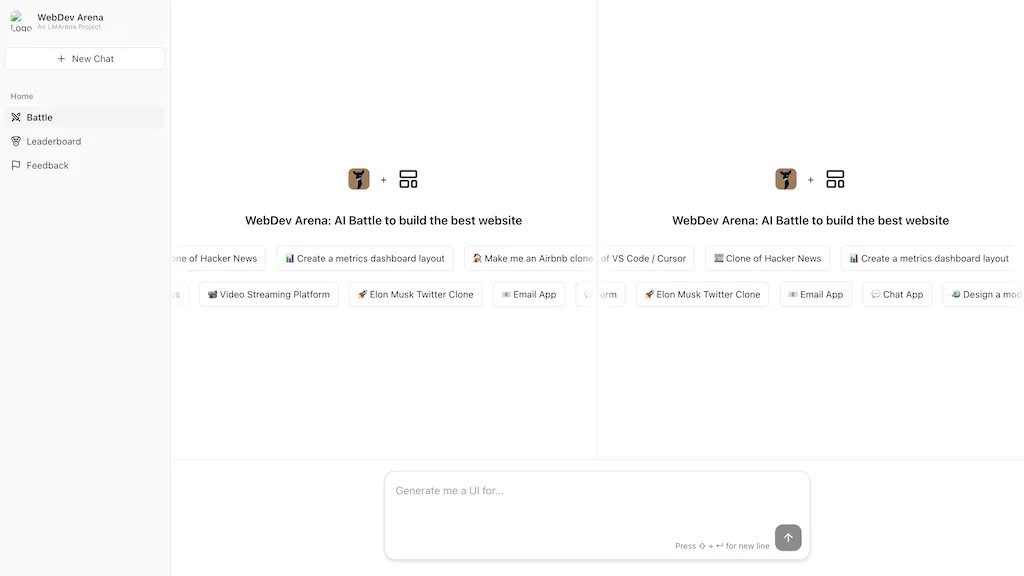
    WebDev Arena is part of LMArena's broader AI evaluation system and is committed to improving the application capabilities of AI in Web development.
    AI Web Development Evaluation Web Development AI Tools
  • Jungle AI

    Jungle AI

    Jungle.ai is an advanced artificial intelligence platform designed to analyze large amounts of sensor data, monitor and optimize the performance of industrial equipment in real time through unsupervised learning technology.
    Machine learning sensor analysis
  • CareIntellect for Oncology

    CareIntellect for Oncology

    CareIntellect for Oncology streamlines patient data, offering a unified view to help doctors make faster treatment decisions and improve patient care.
    CareIntellect for Oncology oncology AI application
  • Aftercare

    Aftercare

    Aftercare offers compassionate support and resources to help individuals navigate recovery with guidance from experienced professionals and a caring community.
    AI surveys
  • llm-graph-builder

    llm-graph-builder

    llm-graph-builder extracts insights from diverse data sources creating structured knowledge graphs, ideal for data scientists and developers.
    Knowledge graph construction LLM knowledge extraction
Selected columns
  • Grok Tutorial

    Grok Tutorial

    Grok is an AI programming assistant. This article introduces the functions, usage methods and practical skills of Grok to help you improve programming efficiency.
  • Gemini Tutorial

    Gemini Tutorial

    Gemini is a multimodal AI model launched by Google. This guide analyzes Gemini's functions, application scenarios and usage methods in detail.
  • ComfyUI Tutorial

    ComfyUI Tutorial

    ComfyUI is an efficient UI development framework. This tutorial details the features, components and practical tips of ComfyUI.
  • Cursor ai Tutorial

    Cursor ai Tutorial

    Cursor is a powerful AI programming editor that integrates intelligent completion, code interpretation and debugging functions. This article explains the core functions and usage methods of Cursor in detail.
  • Second Me Tutorial

    Second Me Tutorial

    Welcome to the Second Me Creation Experience Page! This tutorial will help you quickly create and optimize your second digital identity.