What is GraphRAG-Ollama-UI?
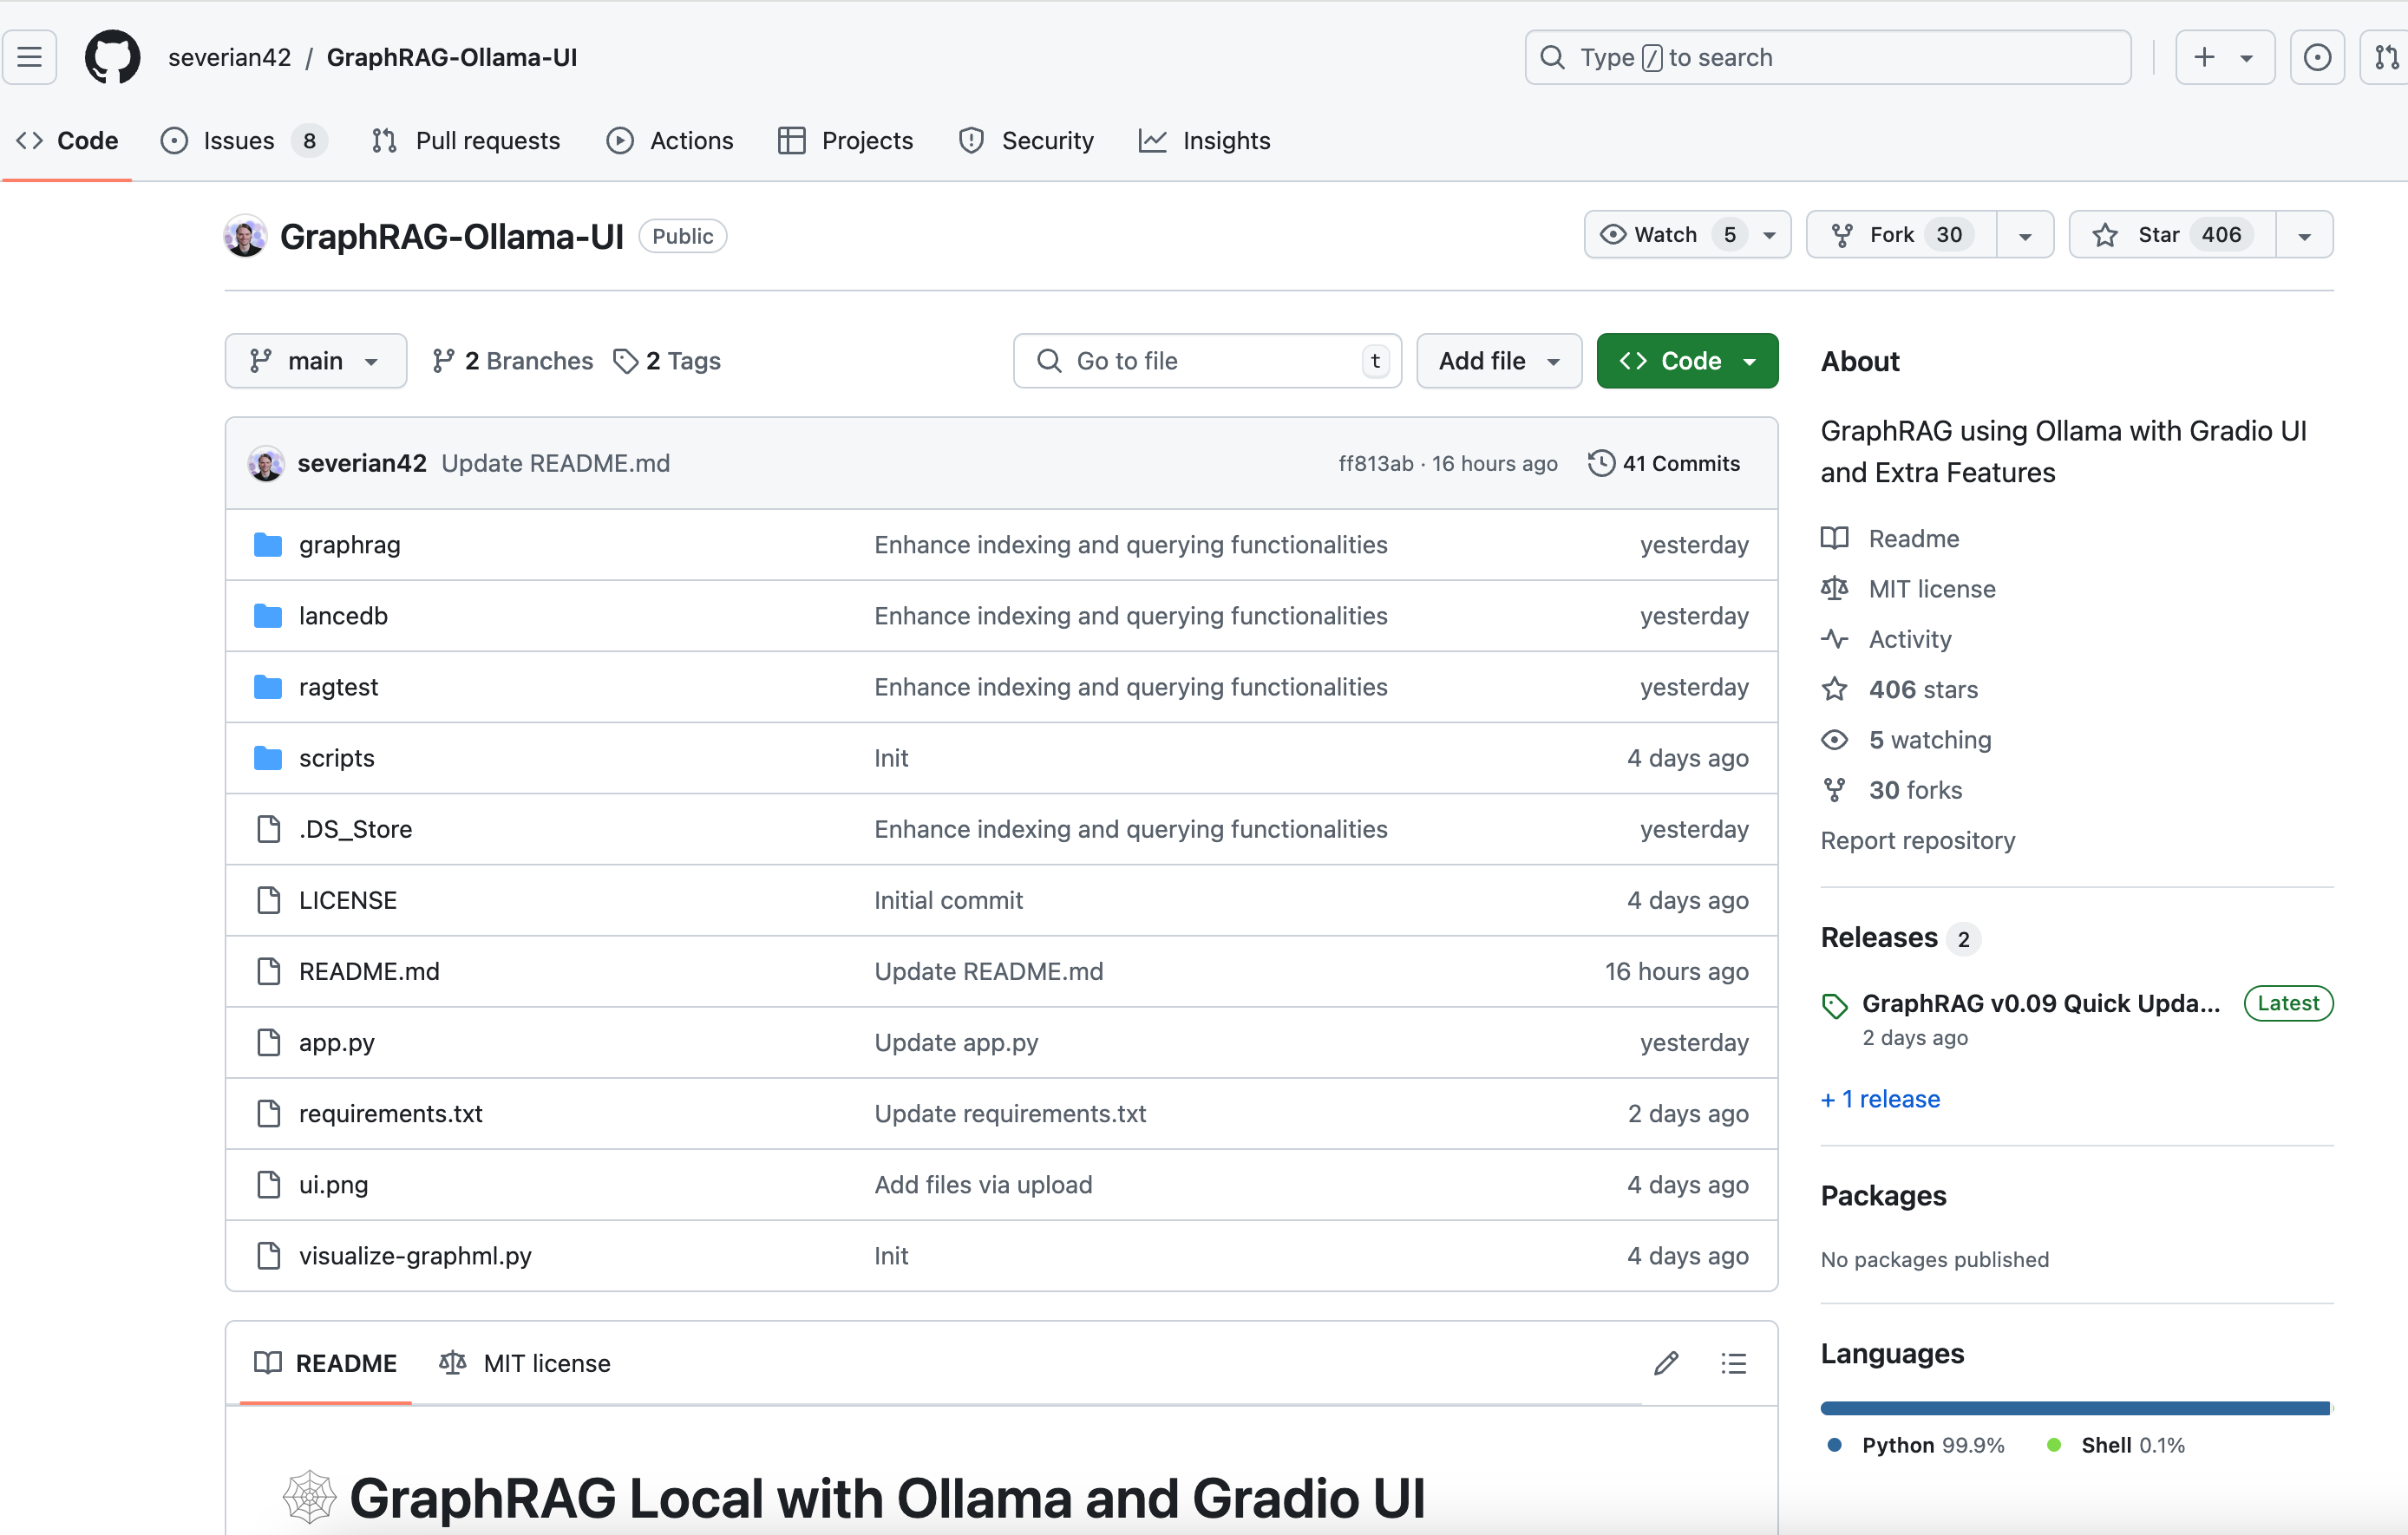
GraphRAG-Ollama-UI is an adaptation of the Microsoft GraphRAG model that supports local use with Ollama. It provides a Gradio-based interactive user interface to facilitate data management, query execution, and result visualization. Key benefits include local model support, cost efficiency, user-friendly interface, real-time graph visualization, file management, setting management, output exploration, and logging.
Who can benefit from GraphRAG-Ollama-UI?
The target audience includes developers and data scientists who need a localized, cost-effective, and easy-to-use model for handling and analyzing knowledge graphs. This tool is ideal for those looking to reduce reliance on external APIs, enhance data processing efficiency, and improve visualization.
Example Scenarios:
Developers can build and query local knowledge graphs, improving flexibility and efficiency.
Data scientists can perform complex queries and analysis for deeper insights.
Educators can demonstrate knowledge graph construction and application in teaching.
Key Features:
Local model support using Ollama for language and embedding models.
Cost-efficient by avoiding expensive OpenAI models.
Interactive UI for managing data, running queries, and visualizing results.
Real-time graph visualization with Plotly in 3D.
File management for uploading, viewing, editing, and deleting input files.
Setting management through the UI for easy updates.
Output exploration for browsing and viewing index outputs and artifacts.
Logging for real-time debugging and monitoring.
Getting Started Guide:
1. Create and activate a new conda environment:
- conda create -n graphrag-ollama -y
- conda activate graphrag-ollama
2. Install Ollama following instructions on its website.
3. Install required packages:
- pip install -r requirements.txt
4. Start the interactive UI:
- gradio app.py or python app.py
5. Use the UI to initialize projects, manage settings, upload files, run indexing, and execute queries.
6. Visualize graphs:
- After running data indexing, go to the "Index Output" tab, select the latest output folder, navigate to the GraphML file, and click "Visualize Graph."


