What is Graphy?
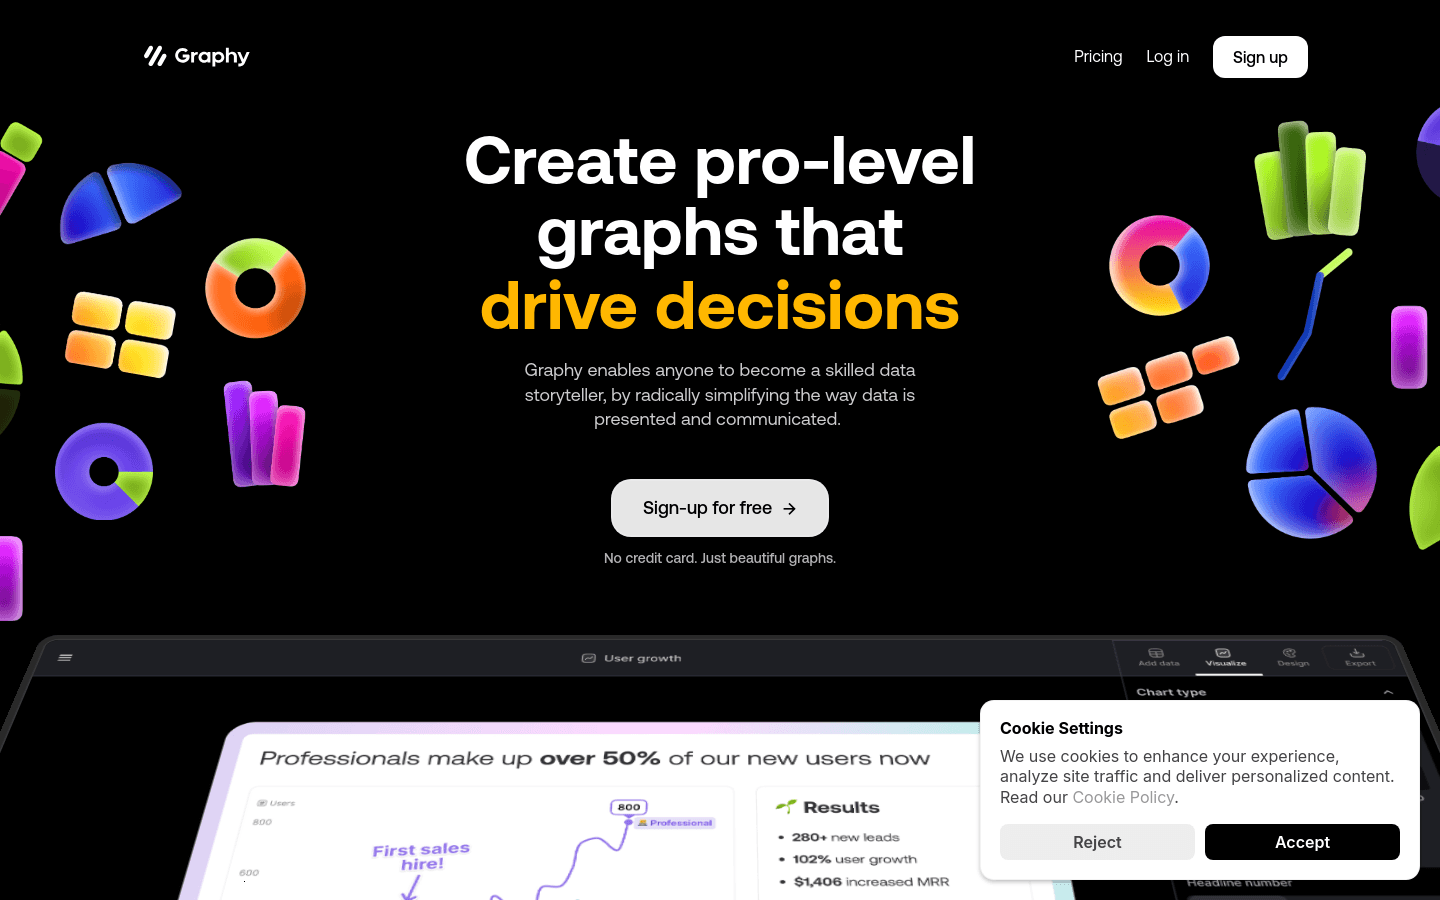
Graphy is a data visualization tool that simplifies how data is presented, making it accessible for anyone to become a proficient storyteller with data. It emphasizes actionability, clarity, and aesthetics to help users make quick decisions and streamline meetings and communication.
Graphy's target audience includes data analysts, product managers, market analysts, entrepreneurs, and any professionals who need data visualization to support their decision-making processes. It is particularly useful for teams that need to quickly and clearly convey data insights to drive business decisions.
For example, Cindy Ibanez from Wynwood House used Graphy to reduce her 5-day report work to just 4 hours. Ryan Hoover from Product Hunt avoided creating another data pivot table with Graphy. Nick Lafferty from Early Exit Club created impressive visual effects for his newsletter, social media, and consulting business using Graphy. Joe Edwards from Venafi found that Graphy helped his team move away from passive data tools and provided stakeholders with necessary context and commentary.
Key Features:
AI-generated charts and insights: Add your data and let Graphy’s AI create charts and explain key insights.
Google Sheets integration: Seamlessly connect with Google Sheets for easy data use.
Support for multiple platforms: Share and use Graphy across platforms like Notion, Canva, and Slack.
Dark mode and light mode: Choose the interface style that suits your preference.
Storytelling capabilities: Enhance your visuals with annotations, trend lines, and more.
API support: Integrate with other tools effortlessly.
Getting Started:
1. Visit the Graphy website and sign up for an account.
2. Log in and connect your Google Sheets or other data sources.
3. Select or paste your data into Graphy.
4. Use Graphy’s AI to generate charts and provide key insights.
5. Customize the chart styles and layouts as needed.
6. Use Graphy’s storytelling features to add annotations and trend lines.
7. Embed the charts in your presentations, reports, or share via links.
8. Integrate with other tools using Graphy’s API when required.
