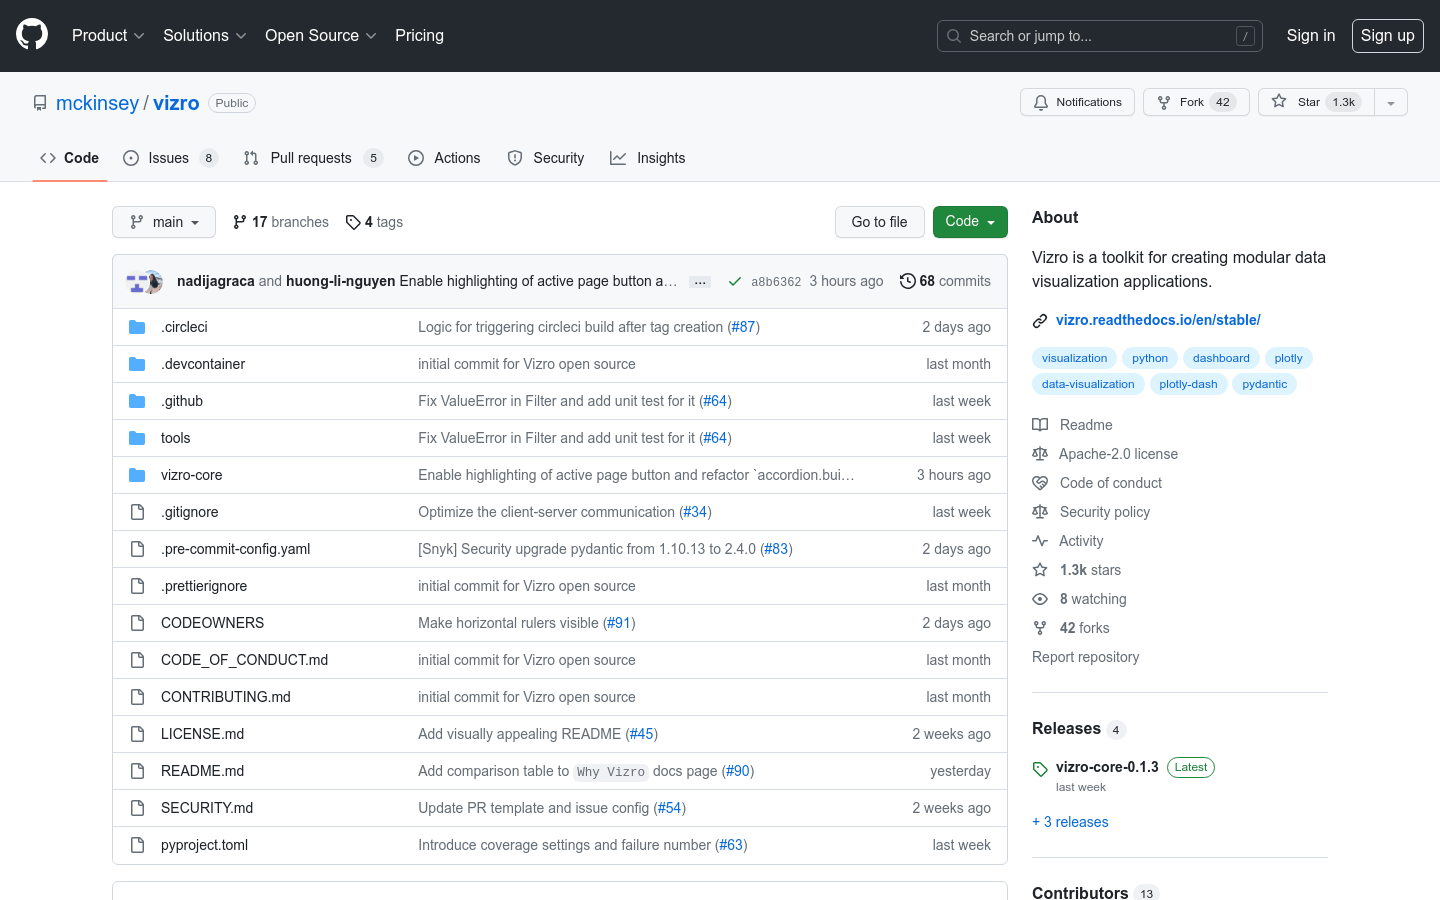
vizro is a toolkit for quickly creating modular data visualization dashboards. It allows users to build complex dashboards through simple configuration without advanced programming and design experience. Users can define components, controllers, pages, layouts, interactions, etc., thereby creating Plotly and Dash-driven dashboards with very little code. vizro perfectly combines low-code and high-code development, ensuring rapid iteration and high customization capabilities.
Demand group:
["Quickly create data analysis and visualization dashboards", "Analyst without coding capabilities can quickly produce reports", "Visual development that requires rapid iteration"]
Example of usage scenario:
The Marketing Analyst used vizro to quickly build a dashboard reflecting business indicators.
Data scientists use vizro as a prototyping tool and highly customize it
The project team uses vizro to quickly iterate internally used reports
Product features:
Quickly build dashboards through configuration files
Supports Plotly and Dash visualization components
Modular design, components can be reused
Combining low-code and high-code development
Flexible configuration, supporting JSON, YAML and other formats
